应用性能终极生存指南
Ultimate application performance survival guide
2021年6月8日
一句话判断
这场 Session 是一份实用的性能问题排查清单——从”App 启动慢”到”滚动卡顿”到”内存暴涨”,每种问题都有对应的 Instruments 工具和排查路径,值得收藏反复查阅。
这场 Session 讲了什么
Session 以”生存指南”的形式,系统地讲解了应用性能问题的诊断方法论。不针对某个具体 API,而是给出一套通用的问题排查框架。涵盖了四大性能维度:启动性能(Launch Performance)、响应性(Responsiveness)、渲染性能(Rendering Performance)和内存效率(Memory Efficiency)。
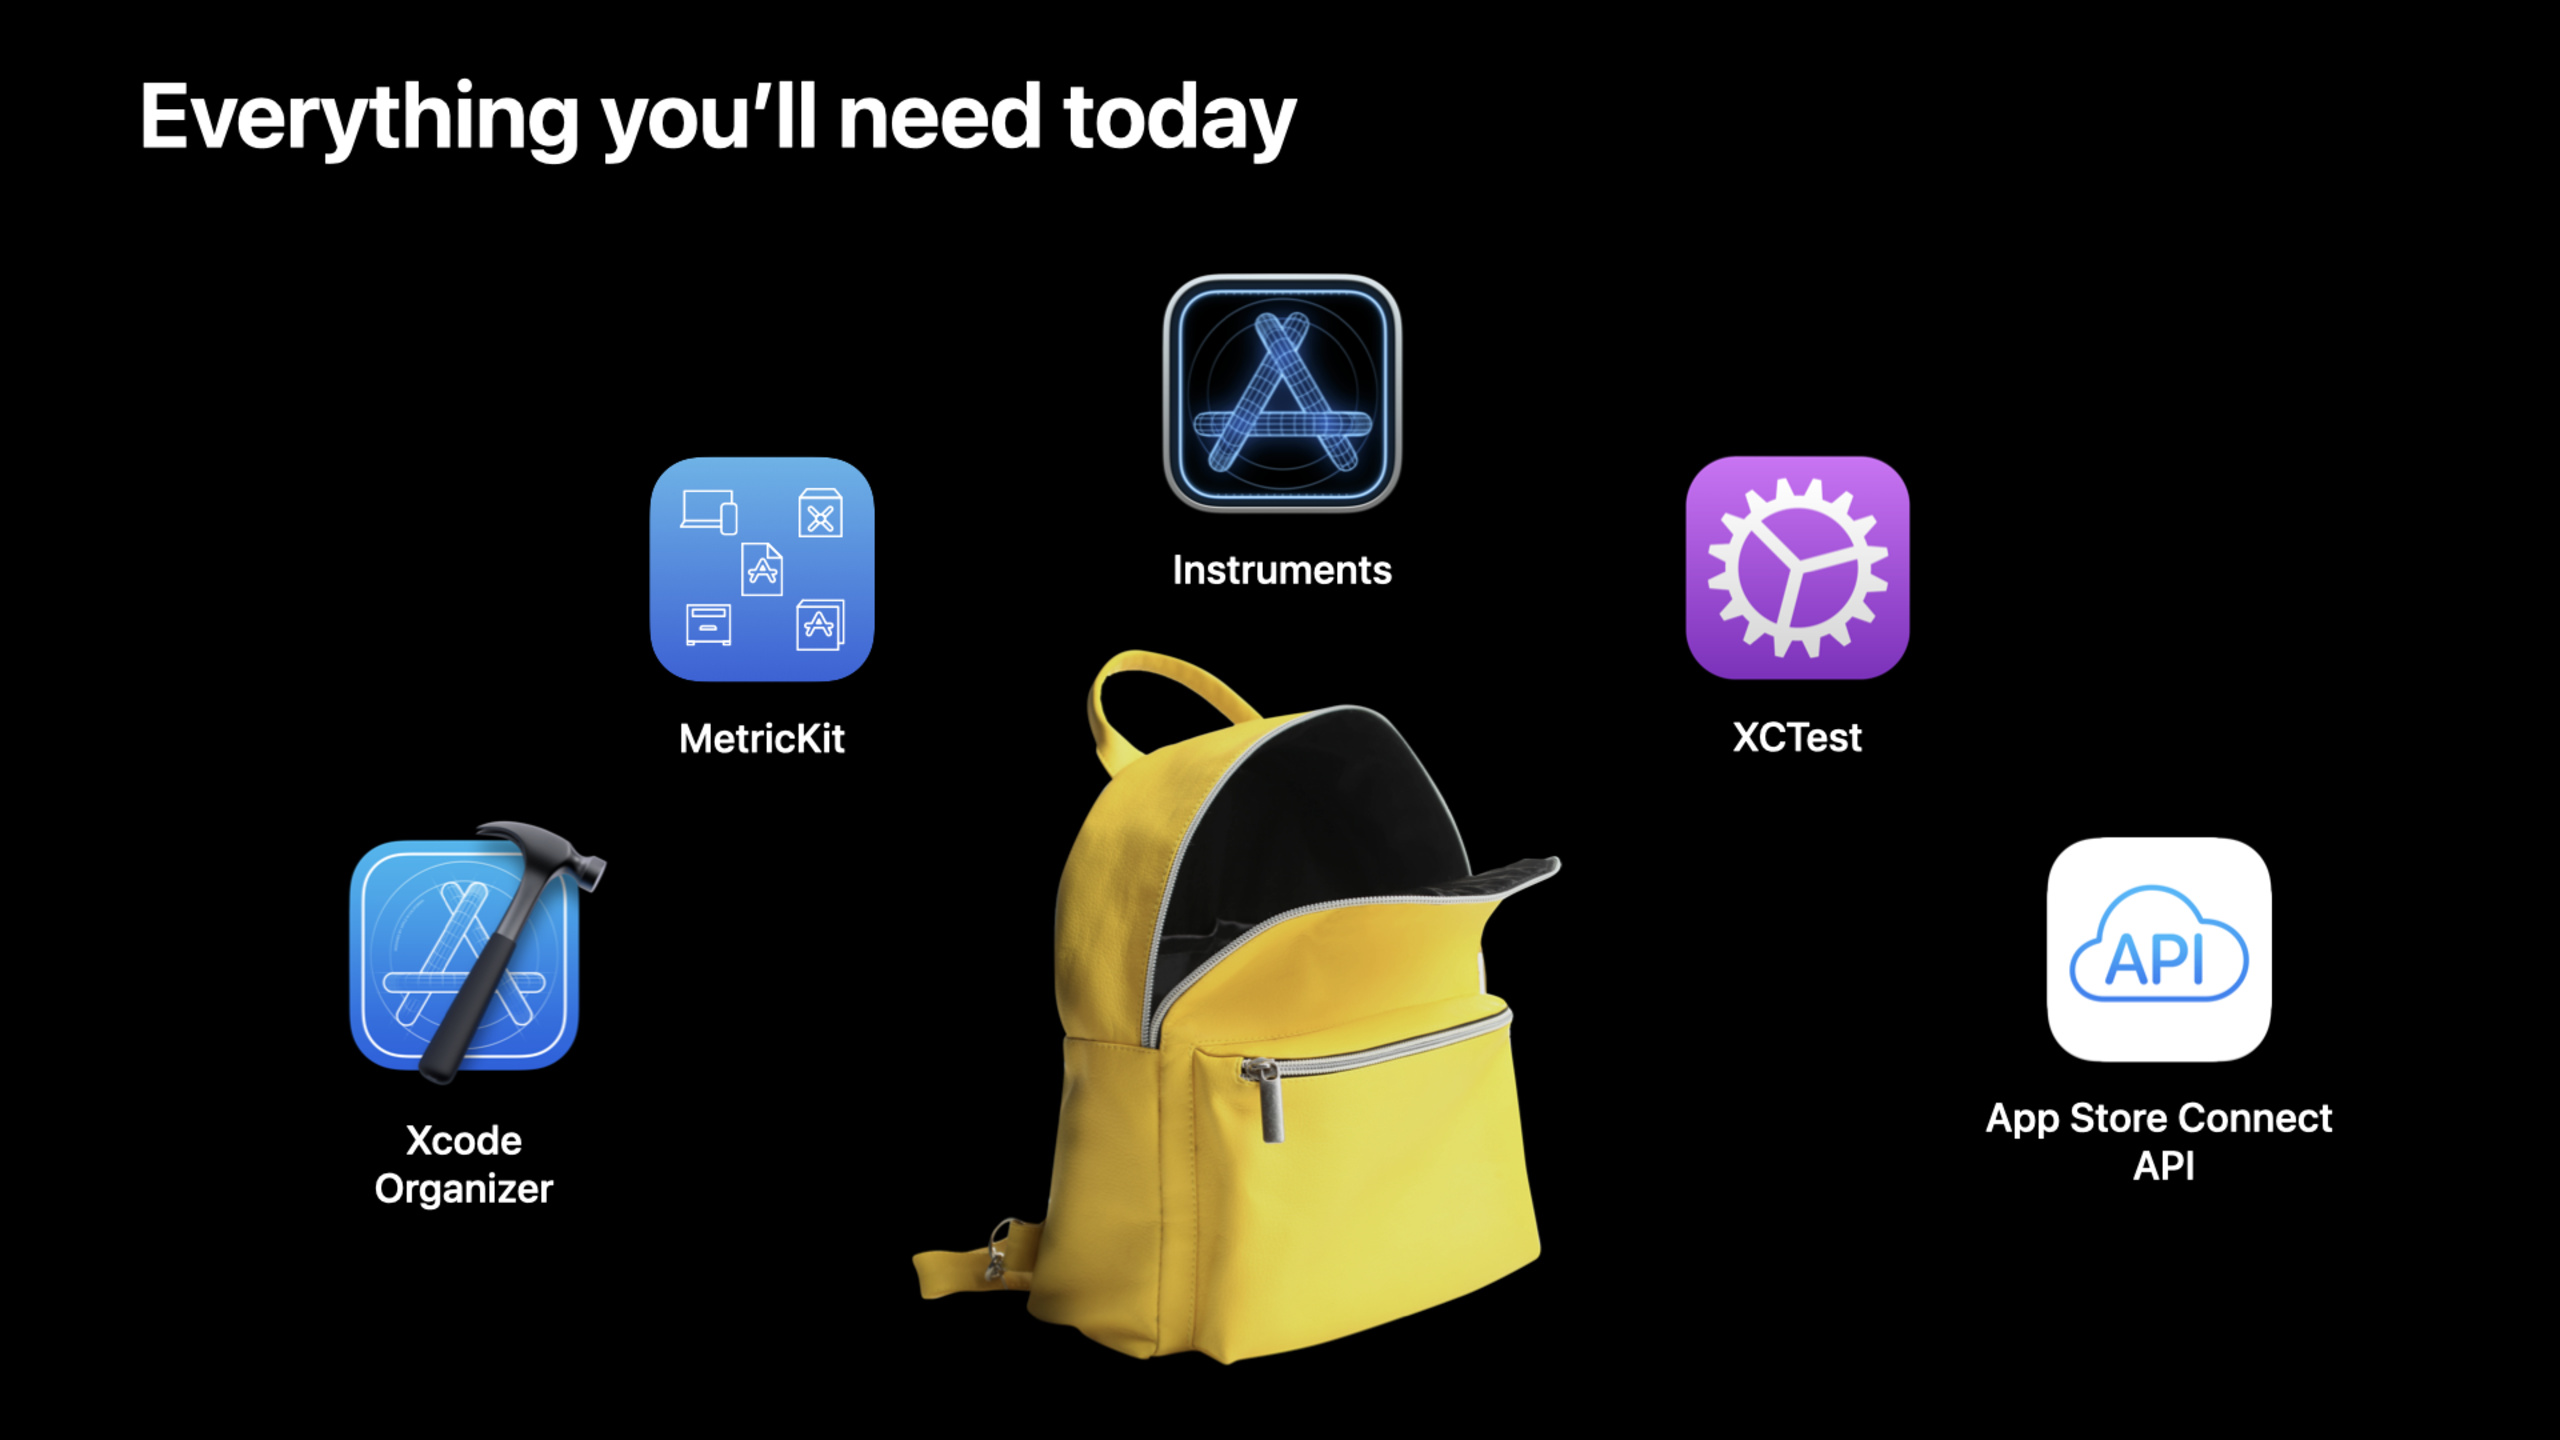
每个维度都遵循”测量 -> 定位 -> 修复 -> 验证”的四步流程。Session 强调性能优化必须从测量开始——凭感觉优化大概率浪费时间在不是瓶颈的地方。Instruments 是测量的核心工具:Time Profiler 定位 CPU 热点、Hangs 检测主线程卡顿、SwiftUI View Profiler 分析视图渲染耗时、Allocations 追踪内存分配。Session 还介绍了 Xcode 13 中新增的 Performance Regression Testing——你可以在测试中设置性能基线,CI 每次构建自动对比。
值得深挖的点
启动性能的冷启动 vs 热启动
冷启动(Cold Launch)是系统刚重启后的首次启动,dyld 需要从磁盘加载所有动态库。热启动(Warm Launch)是 App 最近被打开过,部分库已在缓存中。Session 给出了一个实用的排查流程:先用 Instruments 的 App Launch 模板抓一次完整的冷启动 trace,看 pre-main 时间(动态库加载和初始化)和 post-main 时间(applicationDidFinishLaunching 到首帧渲染)的比例。如果 pre-main 占比超过 30%,合并动态库是最有效的优化手段。
Hangs 诊断的主线程 vs 后台线程
用户感知的”卡顿”有两种:主线程阻塞(UI 无法响应)和后台线程阻塞(数据未准备好导致 UI 等待)。Instruments 的 Hangs instrument 可以精确区分这两种情况。主线程 hang 的典型原因是同步 I/O(磁盘读写、网络请求)和锁竞争。后台线程 hang 通常不会直接导致卡顿,但如果主线程在等待后台线程的结果(通过 DispatchGroup.wait() 或 semaphore),效果等同于主线程 hang。
代码片段
// 测量启动性能:使用 os_signpost 标记关键时间点
import os.signpost

let log = OSLog(subsystem: "com.example.myapp", category: "Launch")

// 在 AppDelegate 或 App 入口标记启动开始
func application(_ application: UIApplication,
                 didFinishLaunchingWithOptions launchOptions: [UIApplication.LaunchOptionsKey: Any]?) -> Bool {
    os_signpost(.begin, log: log, name: "AppLaunch")

    // 初始化核心服务
    os_signpost(.event, log: log, name: "AppLaunch", "开始初始化服务")
    setupServices()

    os_signpost(.event, log: log, name: "AppLaunch", "服务初始化完成")

    return true
}

// 在首帧渲染完成后标记启动结束
struct ContentView: View {
    var body: some View {
        MainContent()
            .onAppear {
                os_signpost(.end, log: log, name: "AppLaunch")
                // Instruments 会自动计算 begin 和 end 之间的时间
            }
    }
}
// 使用 XCTMetric 进行性能回归测试
import XCTest
class PerformanceTests: XCTestCase {
func testLaunchPerformance() throws {
// 测量 App 启动时间
let metric = XCTApplicationLaunchMetric()
let measureOptions = XCTMeasureOptions()
measureOptions.iterationCount = 5
measure(metrics: [metric], options: measureOptions) {
// 启动 App 并等待首屏出现
let app = XCUIApplication()
app.launch()
app.tables.firstMatch.waitForExistence(timeout: 5)
}
// CI 会自动和基线对比,超过阈值则标记为 regression
}
func testScrollPerformance() throws {
let app = XCUIApplication()
app.launch()
let metric = XCTOSSignpostMetric.scrollDecelerationMetric
measure(metrics: [metric]) {
// 模拟滚动操作
let table = app.tables.firstMatch
table.swipeUp(velocity: .fast)
}
}
}// 避免主线程阻塞:将耗时操作移到后台
func loadUserData() async {
// 错误做法:在主线程同步读取大文件
// let data = try Data(contentsOf: fileURL) // 阻塞主线程!
// 正确做法:在后台线程异步读取
let userData = try await withCheckedThrowingContinuation { continuation in
DispatchQueue.global(qos: .userInitiated).async {
do {
let data = try Data(contentsOf: self.fileURL)
let user = try JSONDecoder().decode(User.self, from: data)
continuation.resume(returning: user)
} catch {
continuation.resume(throwing: error)
}
}
}
// 回到主线程更新 UI
await MainActor.run {
updateUI(with: userData)
}
}最佳实践
- 在 CI 管线中集成性能回归测试。Xcode 13 的
XCTMetric支持 App 启动时间、滚动流畅度、CPU 时间和内存峰值等指标,设置基线后每次 PR 自动检测性能退化。 - 性能优化优先级:启动性能 > 滚动流畅度 > 内存效率。用户对启动慢和滚动卡顿的容忍度远低于内存多用几十 MB。
- 每次发布前在低端设备上做性能测试(比如 iPhone SE 或最低配置的 iPad)。在你的 iPhone 13 Pro 上流畅不代表所有用户都流畅。
还有什么值得关注
- Xcode 13 的 Organizer 新增了”Performance”标签页,聚合了用户设备上的实际启动时间和 hang 率数据。
os_proc_available_memory()配合自定义的os_signpost可以在 Instruments 中同时展示内存水位和操作时间线。- SwiftUI 的
TimelineView在调试模式下会自动记录每帧的渲染耗时,用 Instruments 的 SwiftUI View Profiler 查看。