探索 Metal 调试、性能分析和资源创建工具
Discover Metal debugging, profiling, and asset creation tools
2021年6月8日
一句话判断
如果你还在用 printf 调试 Metal shader,Xcode 13 的 GPU 工具更新会让你后悔没早两年认真学 Instruments——这次更新把 GPU 调试体验拉近到了 CPU 调试的水平。
这场 Session 讲了什么
Session 全面介绍了 Xcode 13 中 Metal 开发工具的更新,涵盖调试、性能分析和资源创建三个方面。重点包括:改进的 GPU Frame Capture(支持 ray tracing 操作的捕获和检查)、新的 Metal Performance State(MPS)分析工具、以及扩展的 Metal 资源管理器。
GPU Frame Capture 现在可以捕获完整的 ray tracing 管线——包括 acceleration structure 的构建过程和光线求交结果。你可以逐条光线查看它的发射起点、方向、交点位置和命中几何体,这在以前是不可能做到的。性能分析方面,新的 Metal GPU Counters 增加了 tile 内存使用量、带宽利用率和 GPU 占用率等指标,可以直接在 Instruments 时间线上显示。资源创建方面,Xcode 13 改进了对 .gltf 和 .usdz 格式的支持,开发者可以在编辑器中直接预览和调试 3D 资源。
值得深挖的点
Shader Profiler 的精确计时
Metal Shader Profiler 现在可以精确到单个 draw call 内的不同阶段(vertex processing、fragment processing、tile processing)的耗时。更重要的是,它会在 shader 源码中标注出耗时最长的代码行——类似 CPU profiling 的体验。对于 compute shader,它还显示 threadgroup 的利用率(有多少线程在空等),这对优化 workgroup 大小非常关键。
Acceleration Structure Viewer
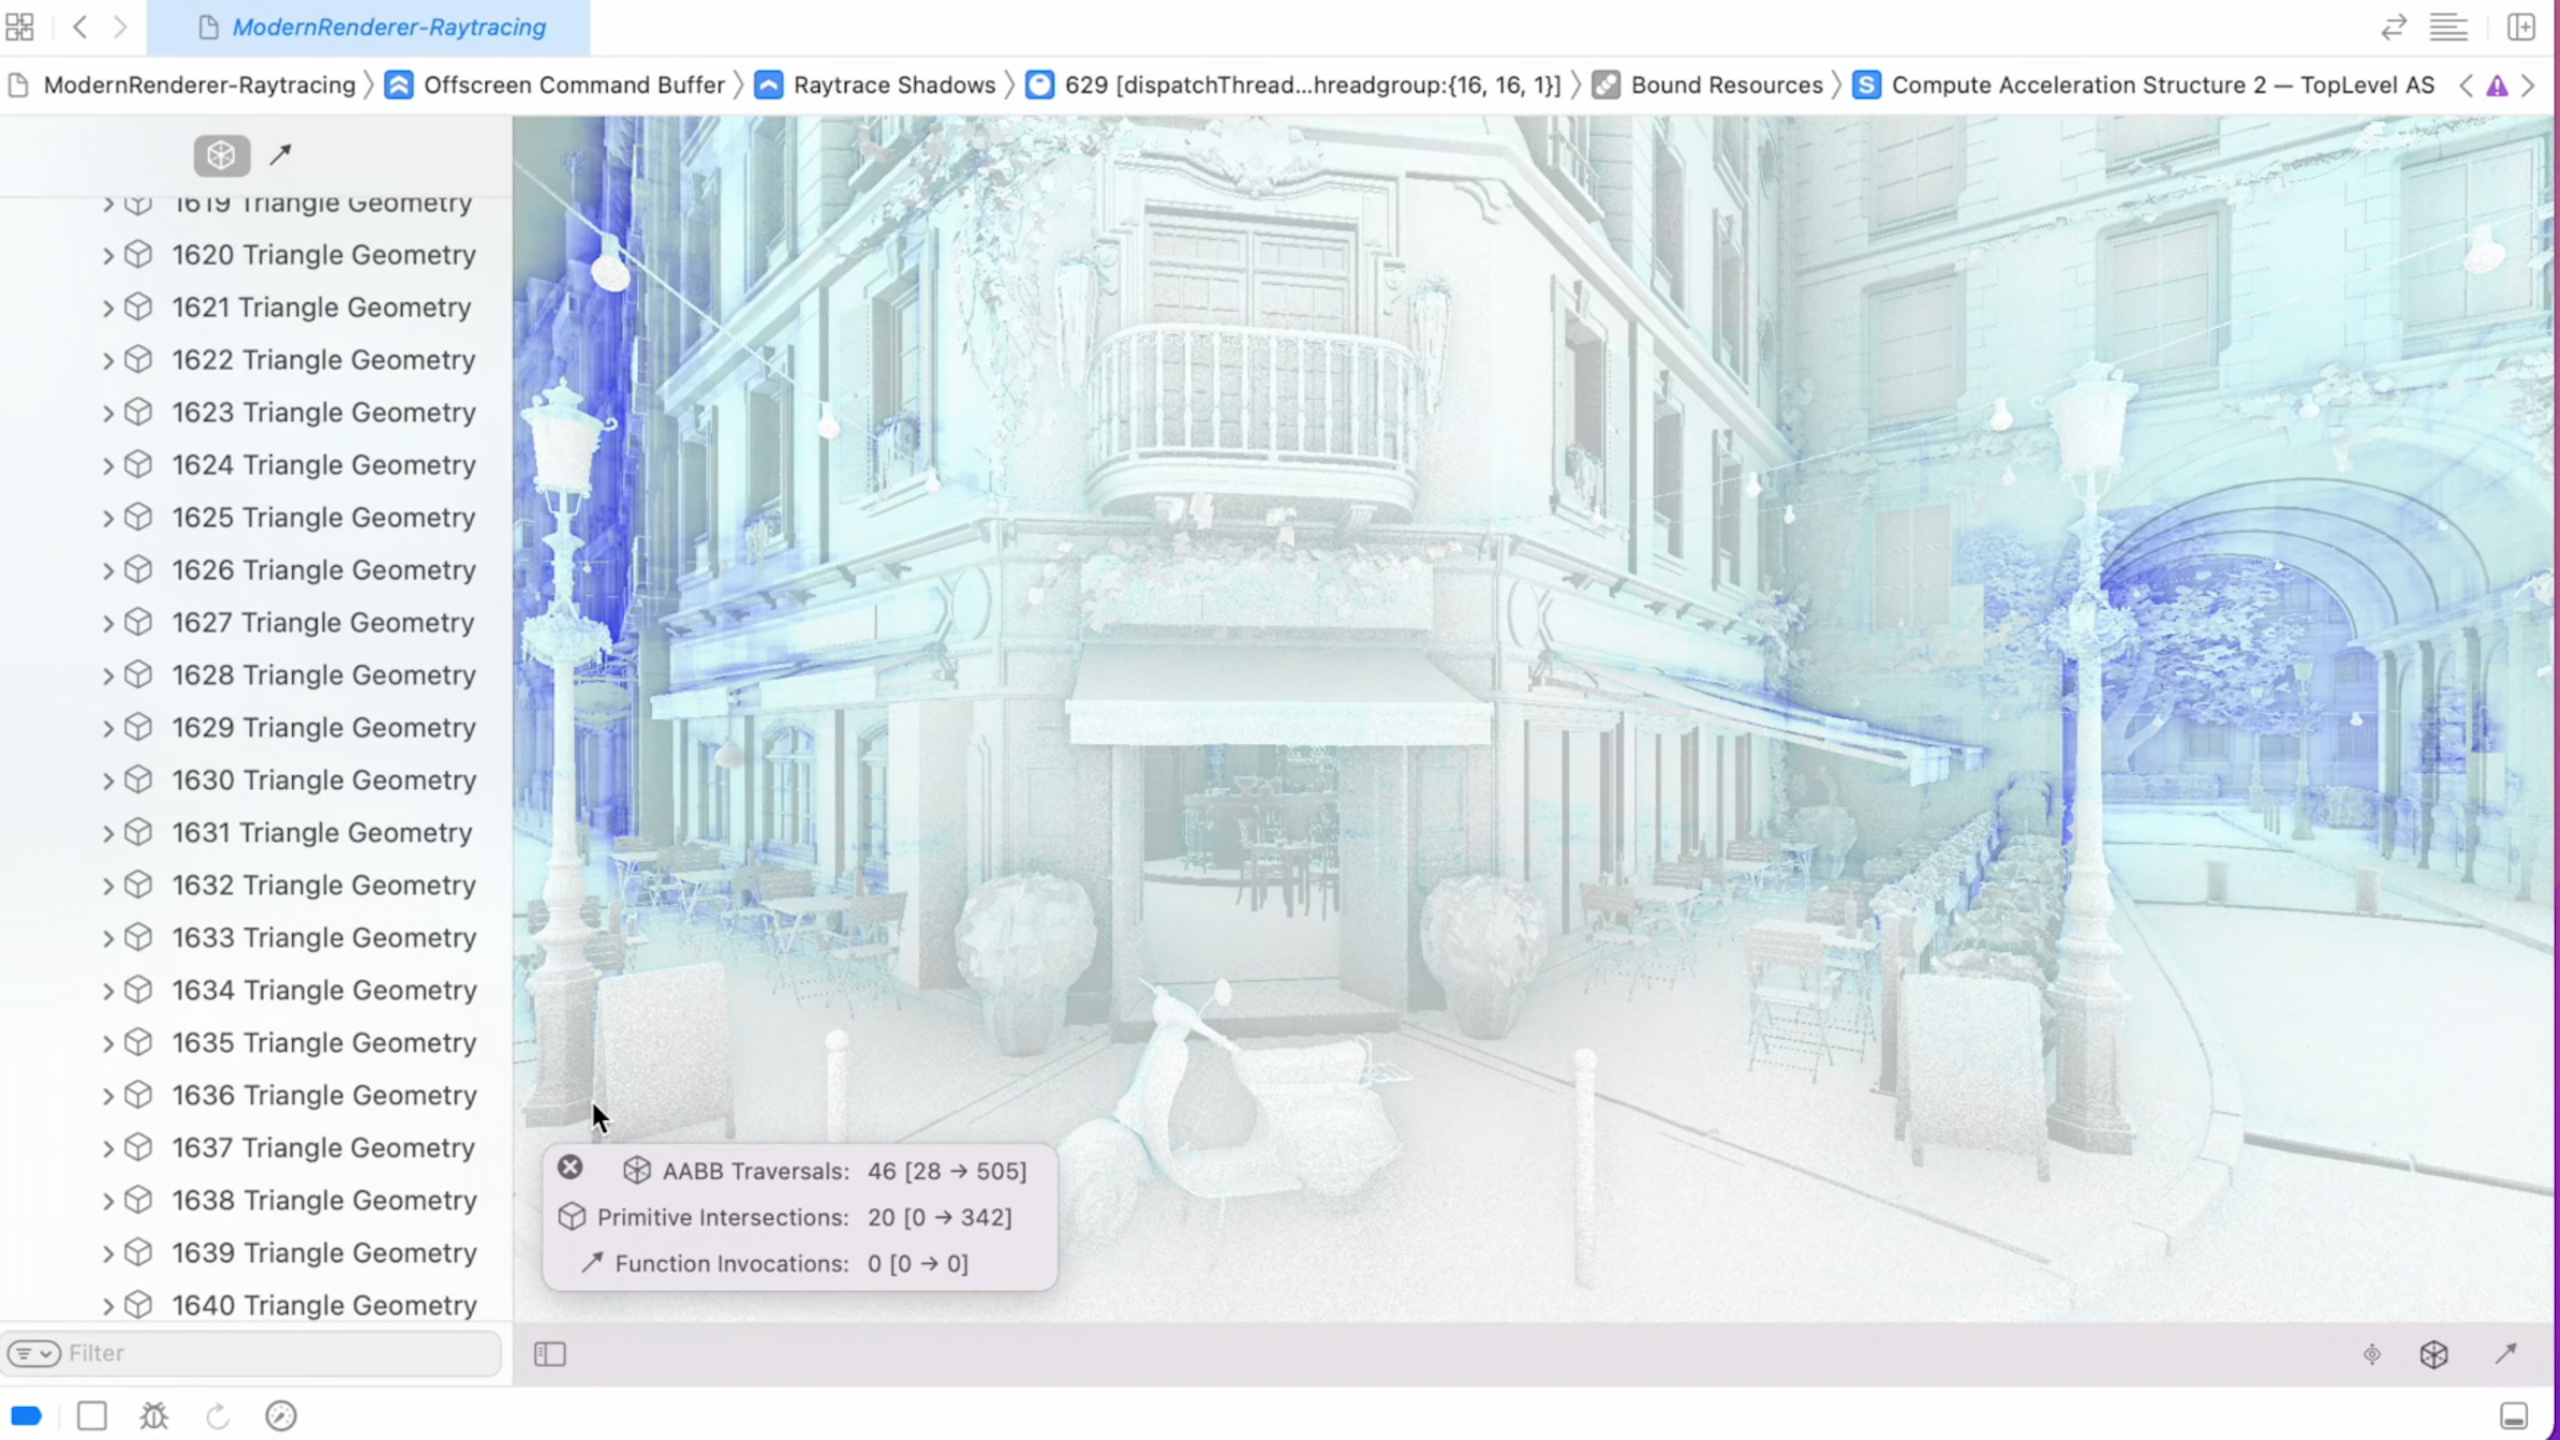
Ray tracing 的调试一直是难点——光线是不可见的。新的 Acceleration Structure Viewer 以可视化方式展示了 BVH 的层级结构:你可以看到顶层加速结构和底层加速结构的节点分布,检查包围盒是否紧密。如果某个物体的包围盒远大于实际几何体(导致光线做大量无效求交),Viewer 会用红色标记出来。这是诊断 ray tracing 性能问题的利器。
代码片段
// 在代码中触发 GPU Frame Capture
// 开发阶段插入,Release 构建时移除
func triggerCapture() {
    let captureManager = MTLCaptureManager.shared()

    let descriptor = MTLCaptureDescriptor()
    descriptor.captureObject = device  // 捕获整个设备的所有操作
    descriptor.destination = .developerTools  // 发送到 Xcode

    do {
        try captureManager.startCapture(with: descriptor)
        // 执行需要调试的渲染帧
        renderOneFrame()
        captureManager.stopCapture()
    } catch {
        print("GPU Capture 启动失败: \(error)")
    }
}
// 使用 Metal GPU 计数器进行运行时性能监控
func setupPerformanceCounters(device: MTLDevice) {
let counterSet = device.counterSets.first { $0.name == "common" }
let descriptor = MTLCounterSampleBufferDescriptor()
descriptor.counterSet = counterSet!
descriptor.sampleCount = 60 // 缓冲 60 个样本
descriptor.storageMode = .shared
let sampleBuffer = try! device.makeCounterSampleBuffer(
descriptor: descriptor)
// 在 command buffer 的特定点采样
// 采样数据包含 GPU 时间、带宽、tile 内存使用等
let encoder = commandBuffer.makeBlitCommandEncoder()!
encoder.sampleCountersInBuffer(sampleBuffer,
atSampleIndex: 0,
withBarrier: true)
encoder.endEncoding()
}// 在 shader 中插入 debug 标记,方便在 Frame Debugger 中定位
// Metal Shading Language
kernel void myComputeKernel(
uint2 tid [[thread_position_in_grid]],
// ... 参数
) {
// Xcode 会在 Frame Debugger 中显示这个标记
// 帮助你在复杂的渲染管线中定位到具体的 compute pass
}最佳实践
- 把 GPU Frame Capture 的触发逻辑封装成一个调试函数,通过编译条件(
#if DEBUG)控制。开发期间随时可以截取一帧来分析。 - 每次渲染管线优化前后都做一次 GPU Frame Capture,对比 draw call 数量、GPU 耗时和带宽变化。凭感觉优化的效果往往不可靠。
- 使用
MTLCommandBuffer.push/popDebugGroup给 render pass 和 compute pass 添加语义化标签。Frame Debugger 中看到”Shadow Pass”比”Draw Call #47”有用得多。
还有什么值得关注
- Xcode 13 的 Memory Graph 现在可以显示 Metal buffer 和 texture 的内存占用,帮助你找到泄漏的 GPU 资源。
- Metal Validation Layer 在 Xcode 13 中新增了对 ray tracing API 参数的校验,比如检测 acceleration structure 的 buffer 是否足够大。
- Instruments 的新 Metal System Trace 模板可以同时显示 CPU 和 GPU 的活动时间线,方便分析 CPU-GPU 的同步瓶颈。