Developer Tools 进阶 20m
用 Power and Performance API 识别性能趋势
Identify trends with the Power and Performance API
2020年6月24日
一句话判断
Xcode 的 Power and Performance API 让你可以把性能指标(CPU、内存、磁盘 I/O)集成到 CI 管线中——做性能回归检测不再需要人工翻 Instruments。
这场 Session 讲了什么
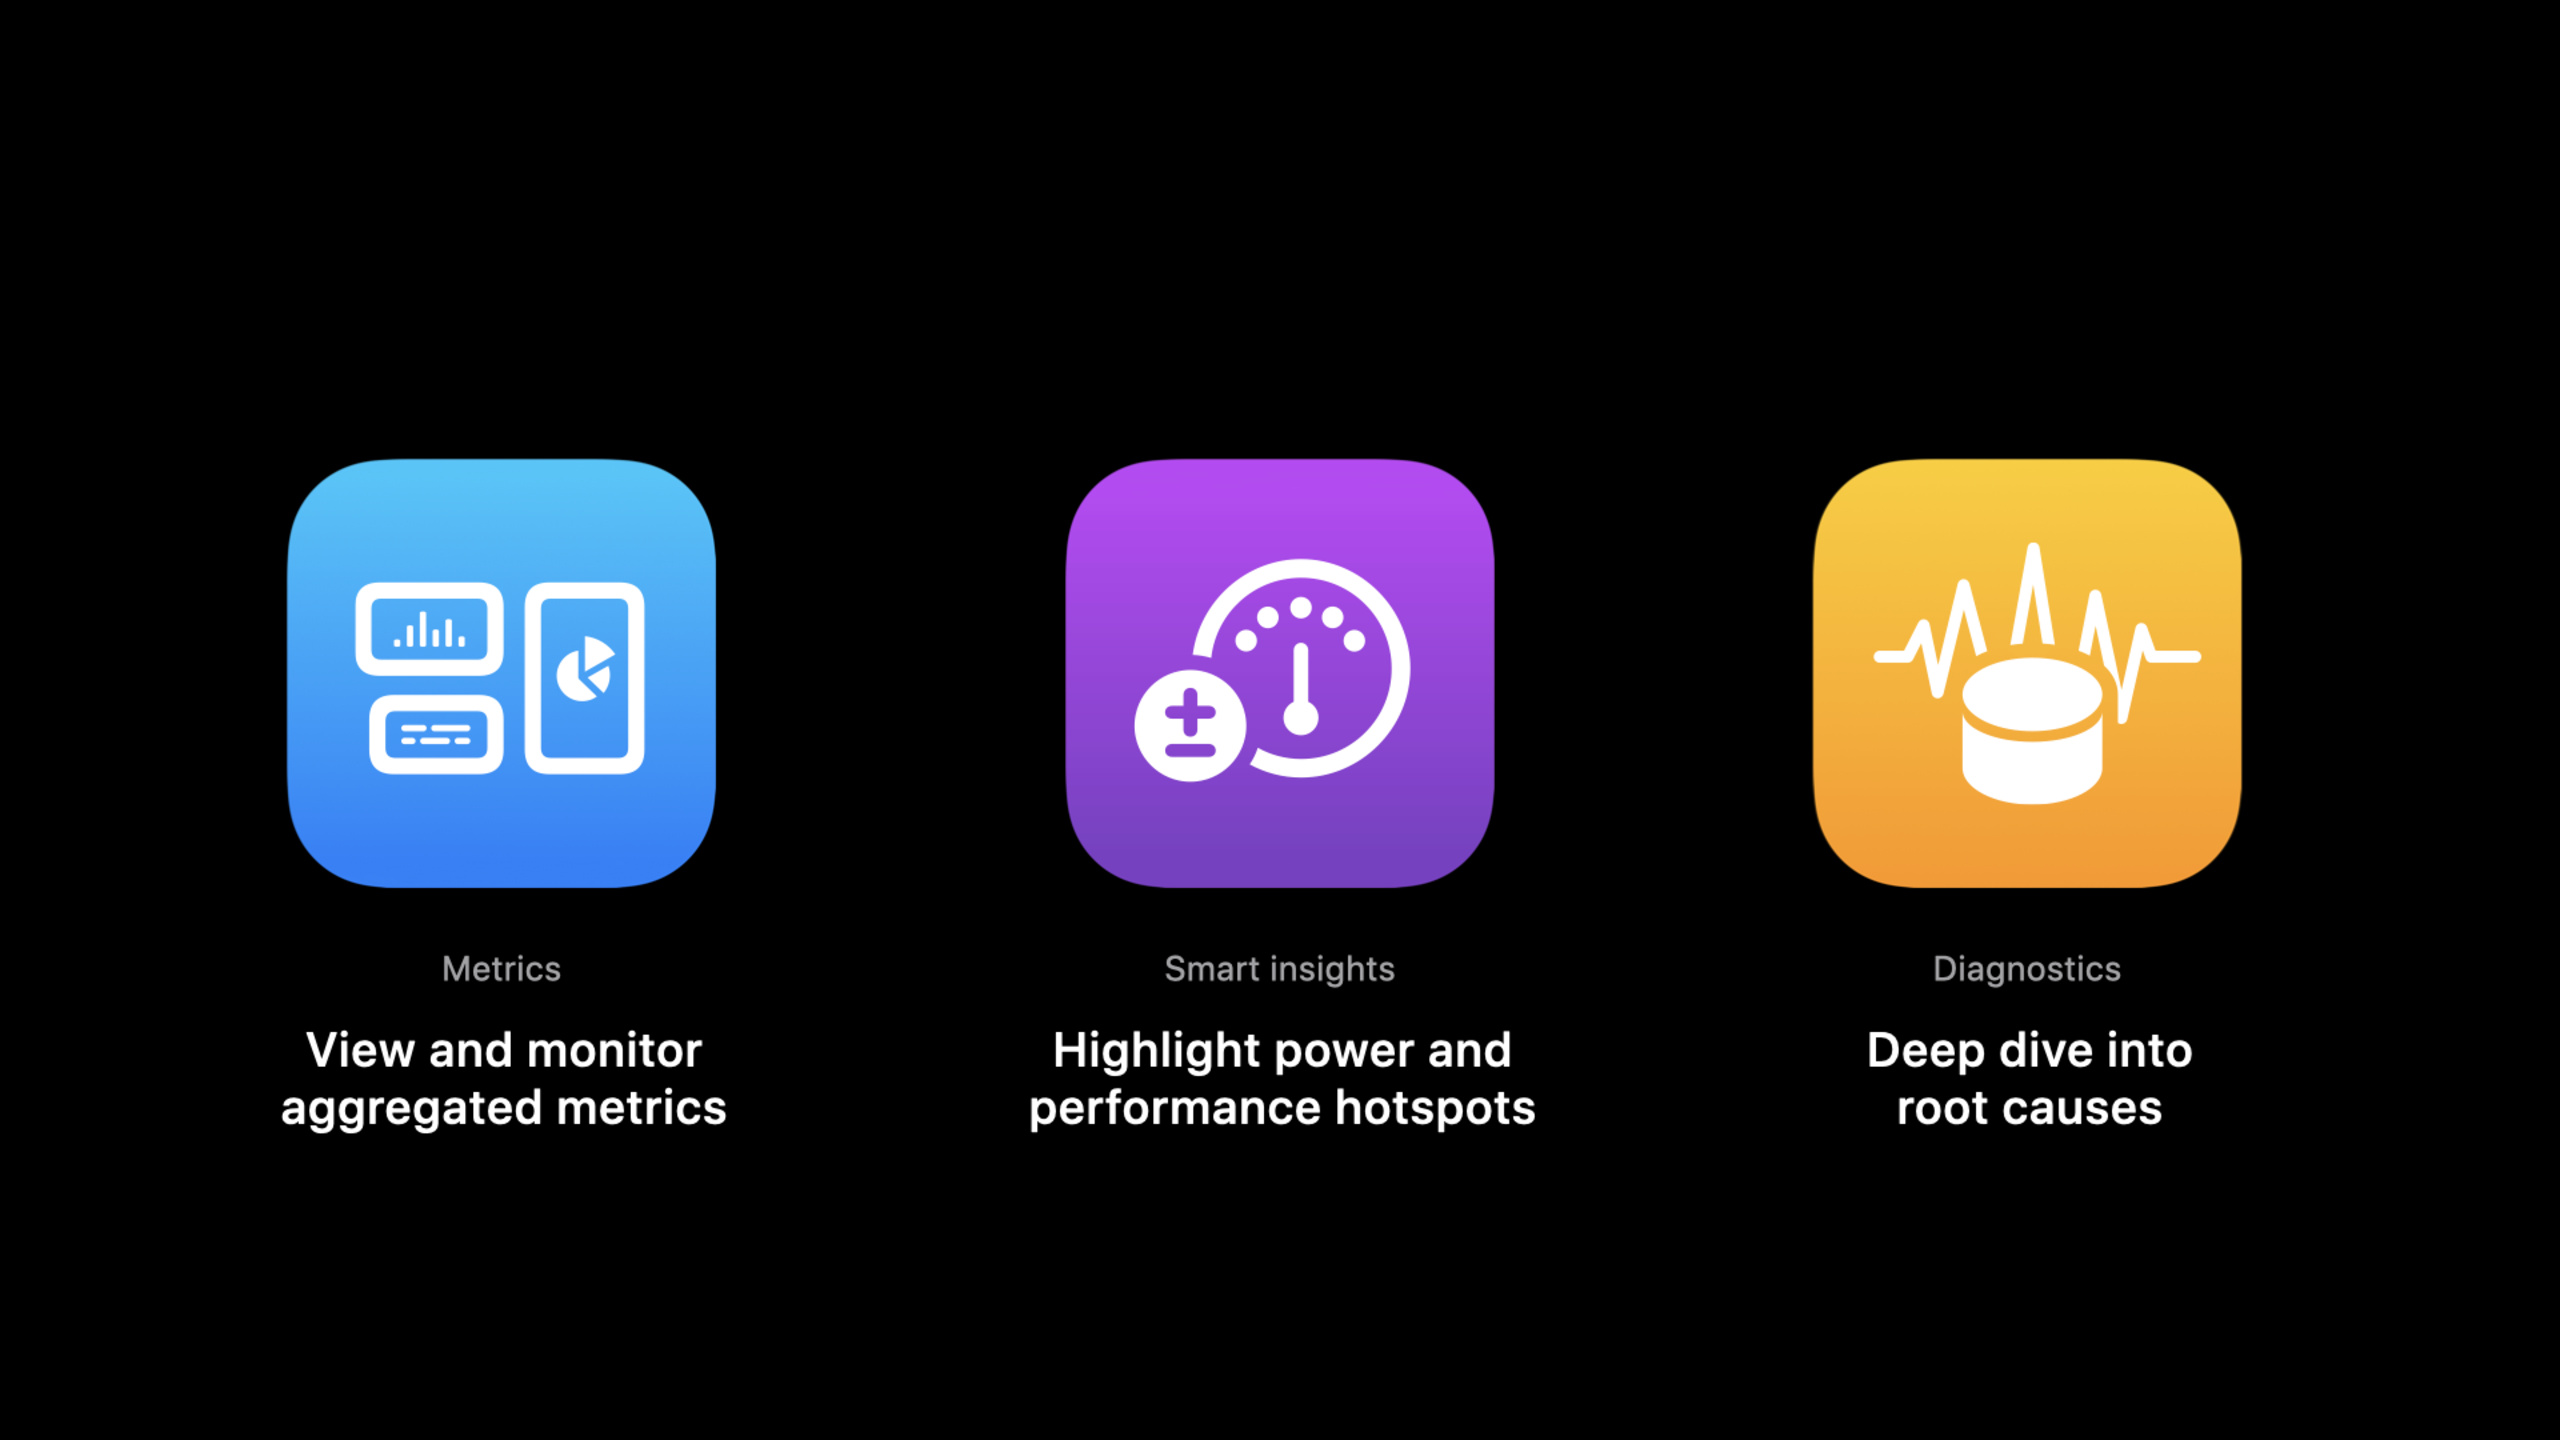
Xcode Organizer 长期以来提供 App 的性能指标(电池使用、启动时间、内存占用等),但这些数据只能在 Xcode GUI 中查看。2020 年苹果开放了 Power and Performance API,允许开发者通过命令行工具和 HTTP API 获取这些指标。
核心使用场景是性能回归检测。你可以在每次 CI 构建后自动收集性能指标,与基线版本对比,如果某个指标超过阈值就发出警告。这比人工看 Instruments 快照高效得多。
Session 还介绍了 xcrun xcc 命令行工具,它可以导出 Xcode Organizer 的指标数据为 JSON 格式,方便集成到第三方仪表盘中。
值得深挖的点
从被动查看到主动监控的转变。 过去你只能在用户反馈”App 变卡了”后才打开 Xcode Organizer 看数据。Power and Performance API 让你可以在每次发版前自动检查性能是否退化,将性能问题拦截在发布之前。
指标维度的选择。 API 提供了多个维度的指标:CPU 使用率、内存峰值、磁盘写入量、网络使用量、电池影响等。不同的 App 关注不同的指标——视频编辑 App 关注 CPU 和内存,社交 App 关注网络和电池。选择对你的 App 最重要的 2-3 个指标设置阈值。
代码片段
# 使用 xcrun 导出性能指标
# 首先需要生成 App Store Connect API Key
xcrun xcc metrics   --app-id "你的 App ID"   --output-format json   --days 7   > metrics.json

# 查看特定版本的启动时间
xcrun xcc metrics   --app-id "你的 App ID"   --metric app-launch-time   --build-version "2.0.0"
# 在 CI 管线中检测性能回归
#!/bin/bash
# 获取最新版本的性能指标
CURRENT_METRICS=$(xcrun xcc metrics --app-id "$APP_ID" --days 1 --output-format json)
# 获取基线版本的指标
BASELINE_METRICS=$(cat baseline_metrics.json)
# 比较启动时间
CURRENT_LAUNCH=$(echo "$CURRENT_METRICS" | jq '.appLaunchTime.p50')
BASELINE_LAUNCH=$(echo "$BASELINE_METRICS" | jq '.appLaunchTime.p50')
# 如果启动时间增加超过 20%,报告回归
THRESHOLD=$(echo "$BASELINE_LAUNCH * 1.2" | bc)
if (( $(echo "$CURRENT_LAUNCH > $THRESHOLD" | bc -l) )); then
echo "警告:启动时间回归!基线: ${BASELINE_LAUNCH}ms, 当前: ${CURRENT_LAUNCH}ms"
exit 1
fi# 使用 App Store Connect API 获取指标数据
import requests
import jwt
import time
# 生成 JWT Token
def generate_token(key_id, issuer_id, private_key):
now = int(time.time())
payload = {
"iss": issuer_id,
"iat": now,
"exp": now + 1200,
"aud": "appstoreconnect-v1"
}
headers = {"alg": "ES256", "kid": key_id, "typ": "JWT"}
return jwt.encode(payload, private_key, algorithm="ES256", headers=headers)
# 获取 App 的性能指标
token = generate_token(KEY_ID, ISSUER_ID, PRIVATE_KEY)
response = requests.get(
f"https://api.appstoreconnect.apple.com/v1/apps/{APP_ID}/perfPowerMetrics",
headers={"Authorization": f"Bearer {token}"}
)最佳实践
- 为每次 CI 构建收集性能指标。 将指标存储在时间序列数据库中,可视化性能趋势。
- 设置合理的回归阈值。 启动时间增加 10% 可能是正常的波动,增加 50% 才值得关注。根据历史数据调整阈值。
- 关注 P90 而非 P50。 中位数可能掩盖了极端情况——P90 或 P95 的性能更能反映”最差用户体验”。
- 结合 XCTMetric 做本地性能测试。 在 CI 管线中跑 XCTMetric 的单元测试,与线上指标互补。
还什么值得关注
- Xcode Organizer 现在支持按设备型号和 OS 版本过滤指标
- 性能指标的数据来源是选择了共享分析的用户,样本量可能不够覆盖所有场景
xcrun xcc还可以导出崩溃日志和用户反馈- Metrics 可以集成到 Slack 或 Teams 的通知流水线中
WWDC 2020